
Introduction: The BI Crossroads
Tableau to Power BI migration is becoming a common step for organizations looking to simplify their analytics stack and reduce costs. As more businesses adopt the Microsoft ecosystem, many are choosing to move from Tableau to Power BI dashboards for better reporting, performance, lower costs and seamless Microsoft integration.
However, migrating from Tableau to Power BI is not just about recreating dashboards. It involves understanding data models, handling complex calculations, and ensuring everything works as expected in a new environment.
In this guide, we will explain how to approach Tableau to Power BI migration, the challenges involved and practical ways to make the transition smoother.
Accelerate Your Migration – See how Sparity’s BIPort automates Tableau to Power BI migration by 70% →
Why are Enterprises Migrating from Tableau to Power BI in 2026?
Enterprises want reporting platforms that are not only powerful but also cost-efficient, scalable, and easy for business users to adopt. For years, Tableau was the top recommendation for data visualization and reporting, but Power BI has overtaken Tableau in adoption, performance, and value delivery. Here’s why:
- AI & Advanced Analytics – Microsoft Power BI has built-in AI, natural language queries, and predictive insights which are absent in static dashboards.
- Speed and Performance – The in-memory technology and optimization, assists to load reports faster and scale seamlessly across large datasets.
- Licensing Cost – Power BI delivers enterprise-grade analytics at a fraction of Tableau’s pricing, making it cost-efficient for organizations of all sizes.
- Integration with Microsoft Ecosystem – Native integration with Excel, Teams, Azure, and Microsoft 365 ensures a connected, unified analytics experience.
Tableau to Power BI Migration is Accelerating: Analyst & Market Insights
This migration is not just a trend, it is being established as the new norm for organizations looking for agility, cost savings, and future ready analytics.
According to Gartner Magic Quadrant for Analytics & BI Platforms, Microsoft Power BI continues to dominate as a Leader, securing the highest scores in both Ability to Execute and Completeness of Vision. This recognition isn’t just about popularity, it reflects how Power BI’s ecosystem, integration with Microsoft tools, and rapid pace of innovation make it the first choice for enterprises serious about scaling data-driven decision-making.
Here’s another research from Market.us projects that the global Business Intelligence market will skyrocket to $55.48 billion by 2026. With organizations under mounting pressure to do more with less, it’s no surprise that leaders are accelerating their migration from Tableau to Power BI to capture better ROI and streamline licensing costs.
Accelerate Your Tableau to Power BI Migration
Now you can accelerate your Tableau to Power BI migration with Sparity’s AI-powered BIPort Migration Assistant. It helps organizations seamlessly transition from Tableau to Power BI without dealing with technical complexities, resource constraints, or manual errors.
BIPort supports key stages of migration, including report analysis, conversion, and data model transformation. It also enables the transition of semantic models and metadata while maintaining data accuracy, consistency, and security.
Unlock the full potential of Power BI’s capabilities with Sparity’s BIPort Migration Assistant: The First-of-Its-Kind Solution for Automating Tableau to Power BI Reports Migration.
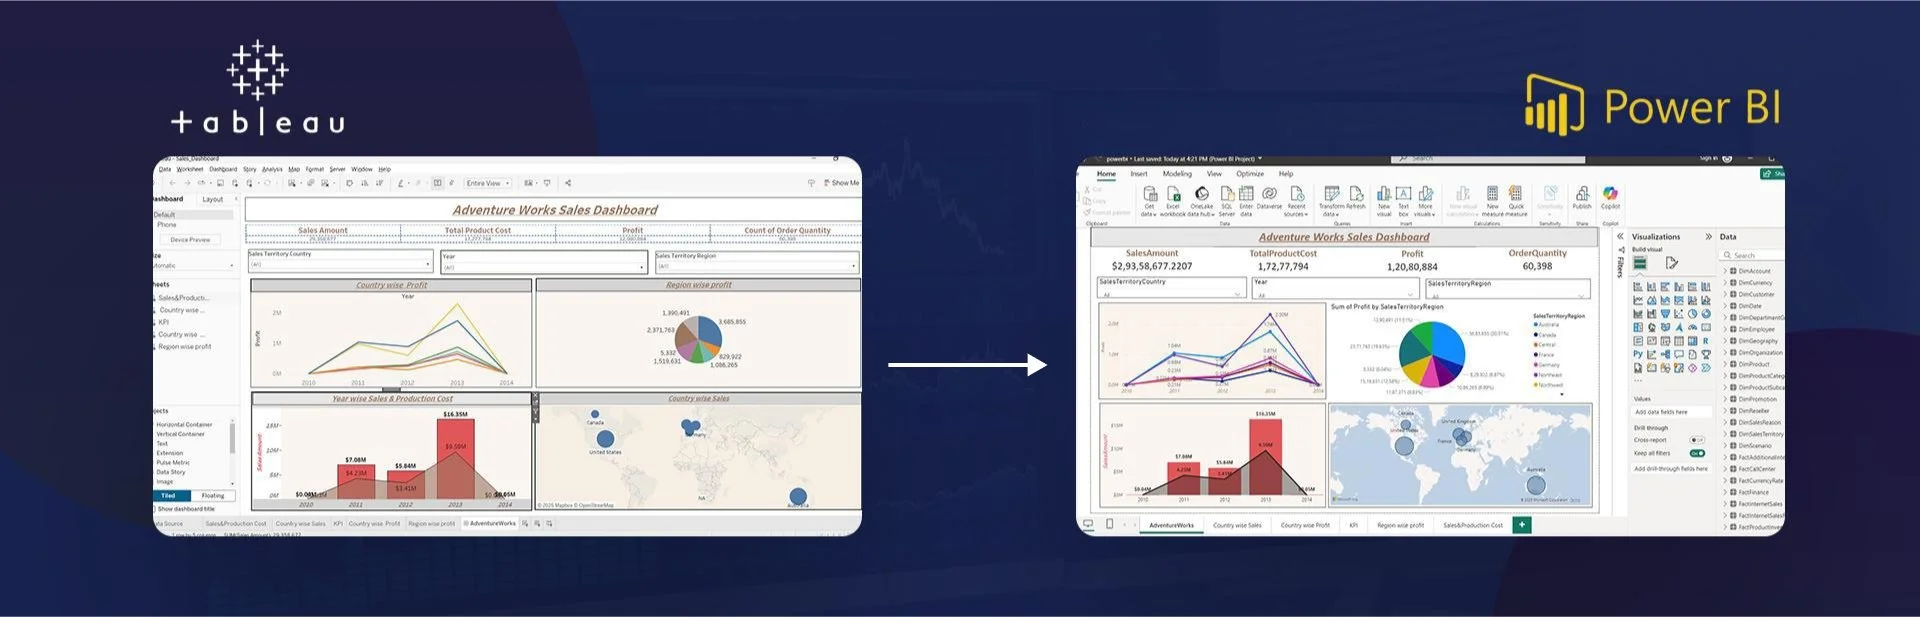
Tableau to Power BI Pre-Migration Steps:
These steps help organizations efficiently migrate Tableau to Power BI while maintaining data accuracy and performance. Before getting started, you can also refer to our detailed BI migration checklist to ensure nothing is missed.
Assessment
Before migrating from Tableau to Power BI, it’s essential to conduct a thorough assessment of your current Tableau environment, including understanding the purpose, functionality, and user requirements of each report. This includes identifying data sources like databases, files, web services, and APIs. Understanding the current state of your Tableau reports will help plan a smooth transition, and gather feedback from users to ensure their needs are met.
Compatibility Check
To ensure compatibility between both BI tools, verify data sources, connectors, and features. Check if Power BI offers equivalent capabilities to Tableau’s features and functionalities. Evaluate the capabilities of both systems to identify potential challenges or limitations before migration. This evaluation will help identify potential limitations.
Clean Up
It’s essential to clean up your Tableau workbooks by removing unused data sources, calculations, or visualizations. This will make the migration process more efficient and reduce the risk of carrying over unnecessary elements from Tableau to Power BI. Optimizing your workbooks by simplifying calculations or restructuring data models can also help ensure a more streamlined migration from Tableau to Power BI.
Data Source Connection
To migrate Data Of Tableau to Power BI , establish data source connections in Power BI. Identify Tableau’s data sources, including databases, files, and web services. Configure connections to databases like SQL Server, MySQL, or Oracle, and provide necessary credentials. Import Excel or CSV files into Power BI or establish connections. Recreate connections to web services or APIs using Power BI connectors. Use data transformation tools like Power Query to clean and prepare data for visualization..
Visualization Migration
To migrate Tableau visualizations to Power BI, you need to recreate charts, graphs, and dashboards in Power BI while maintaining the same functionality and look and feel as the original reports. This includes applying consistent formatting, adding interactive elements like filters and drill-downs, and rebuilding calculations using Power BI’s DAX language to ensure the same logic and results.
Testing and Validation
It’s crucial to conduct thorough testing and validation. Compare key reports between Tableau and Power BI for accuracy and consistency. Involve users in User Acceptance Testing (UAT) for feedback and adjustments. Perform performance testing, especially for large datasets or complex visualizations, and optimize queries and report design for optimal performance. This phase is crucial for identifying and resolving issues before report rollout.
Deployment
Create a rollout plan for deployment, considering user training, permissions, and security settings. Offer training sessions to facilitate the transition from Tableau to Power BI, set up appropriate access controls, monitor usage post-deployment, and gather user feedback. Continuously improve the reports based on user experiences to enhance their usability and effectiveness.
Building Reports in Power BI
The process of building reports and dashboards in Power BI, and the process of rebuilding reports and dashboards for migration from Tableau to Power BI, share many similarities but have some distinct differences due to the context of migration.
Data Source Connection: When building reports from scratch in Power BI, you start fresh with connecting to data. In migration, you are connecting to existing data sources used in Tableau.
Rebuilding vs. Building: In migration, you are replicating what was previously done in Tableau. This can involve reverse-engineering existing reports and visualizations.
Conversion of Logic: Calculations and logic implemented in Tableau need to be translated to Power BI’s DAX language during migration.
Styling and Formatting: In migration, there may be an effort to match the look and feel of Tableau reports. When building from scratch, you have more freedom to design without matching existing styles.
The migration process in Power BI involves replicating Tableau logic and designs, which can be more challenging than building reports from scratch due to the need for alignment with existing structures and styles, despite the fundamental steps remaining the same.

Tableau to Power BI Post-Migration Support:
After the migration from Tableau to Power BI, it’s crucial to provide ongoing support to users. This includes offering training sessions, creating documentation highlighting the differences between both tools, and providing support channels for any questions or issues. This will ensure a successful transition and maximize user adoption, ensuring a smooth transition to Power BI.
Key Consideration to Compare Features in Tableau to Power BI
Calculated Columns and Measures
Tableau’s calculated fields enable users to perform various calculations, including mathematical operations, conditional logic, and string manipulations, directly within the platform. These fields provide flexibility for dynamic analysis, enabling users to generate new metrics based on existing data or generate complex formulas. Similar to Power BI measures, calculated fields in Tableau enable users to explore and visualize data meaningfully.
Creating Charts
Power BI allows users to create various types of charts, including pie charts, within the visualization interface, allowing for easy customization and formatting. It supports multiple charts on a single page, allowing efficient data comparison and analysis. Tableau offers a drag-and-drop functionality for creating charts and visualizations, streamlining data exploration and presentation. Formatting is done within the chart editing interface, providing precise control over visualization appearance. Each chart is housed on a separate worksheet, facilitating focused analysis of specific data sets.
Time Intelligence Functions
Both powerful data analysis tools. Power BI uses time intelligence functions like PARALLELPERIOD in DAX to perform sophisticated calculations like year-over-year comparisons and moving averages. These functions rely on date columns for time-based analysis, and users can create customized calculations based on time dimensions. Tableau uses date functions and fields for time series analysis, allowing users to define intricate time-based metrics and uncover trends within their datasets. Both platforms provide the necessary tools for effectively navigating and analyzing time-based data.
Interactions
Tableau’s interactivity feature enhances data exploration and analysis by allowing users to filter across multiple charts and visualizations. Dashboard actions enable users to dynamically filter data by clicking on specific elements. Parameters and actions provide a robust framework for interactivity, allowing users to customize their views and delve into the details that matter most. This feature ensures a rich and engaging analytics experience for users, whether drilling down into specific data points or gaining a holistic view of trends.
Dashboard Creation
Power BI Services create dashboards by pinning reports to the dashboard, allowing users to arrange and format these visuals directly within the interface. Tableau Desktop creates dashboards by adding reports and sheets to the dashboard canvas, with layout and formatting meticulously designed within the interface. Both platforms offer robust options for creating impactful dashboards, tailored to meet the needs of data analysts and visualization professionals.
How to Migrate from Tableau to Power BI
Migrating from Tableau to Power BI can open up new possibilities for better insights and more streamlined analytics. As part of the Microsoft ecosystem, Power BI offers strong integration, scalability, and advanced capabilities that can significantly improve how organizations work with data. While the transition may come with its own set of challenge but the right planning and execution can make the process smooth and successful.
At Sparity, we specialize in seamless data migrations, particularly from Tableau to Power BI. Let us handle the complexities for you, ensuring a smooth transition with minimal disruption. With our expertise, your organization can unlock the full potential of Power BI’s capabilities. Choose Sparity to embark on this journey, where efficiency and precision meet to elevate your data analytics experience.
FAQs
What are the benefits of Tableau to Power BI migration for enterprises?
Migrating to Power BI delivers immediate ROI through a 70% reduction in licensing costs and 70% faster dashboard performance by leveraging the Microsoft Fabric engine. Our Agentic migration approach further accelerates time-to-market by automating manual logic mapping, saving hundreds of developer hours while ensuring a scalable, unified governance framework.
Is it difficult to migrate from Tableau to Power BI?
Yes, migration can be complex due to differences in data models, calculations, and visualization structures. However, using automated tools like BIPort can simplify the process significantly.
Will there be downtime for business users during the migration?
No. We follow a Parallel Run Strategy. Your Tableau environment remains fully operational while we build and validate the Power BI ecosystem. We only flip the switch once User Acceptance Testing confirms 100% accuracy, ensuring a seamless transition with zero downtime.
How long does Tableau to Power BI migration take?
The timeline for Tableau to Power BI migration depends on the complexity and scale of the project. For small projects with a few dashboards, it may take a few days, while larger migrations involving multiple data sources and complex reports can take several weeks. Our BIPort can significantly speed up the process and reduce time by 60-70%.
What is the biggest challenge in Tableau to Power BI transition?
The biggest challenge in moving from Tableau to Power BI is converting Tableau’s calculations and data model into Power BI’s DAX and structure. Since both tools work differently when it comes to relationships, aggregations, and visuals, rebuilding complex dashboards while keeping data accurate and performance intact can take significant effort.
How to convert Tableau reports to Power BI dashboards?
To convert Tableau reports into Power BI dashboards, you need to recreate them in Power BI. This involves connecting to the same data sources, rebuilding the data model, rewriting calculations using DAX, and redesigning visuals to match the original reports.
Is Tableau to Power BI migration automated?
Yes, Tableau to Power BI migration is partially automated. While complex elements like DAX rewriting and data validation traditionally require manual effort, AI-powered tools like Sparity’s BIPort can automate up to 70% of the conversion process. This significantly reduces manual errors and accelerates the transition from Tableau workbooks (.twb) to Power BI reports (.pbix).
FAQs