
Data is at the heart of every business decision, but selecting the right Business Intelligence (BI) tool is a strategic decision. Power BI and Tableau are two of the most powerful platforms, each having its benefits. Choosing between two powerful platform alternatives can be confusing for organizations aiming to derive value from their data.
Sparity, as experts in BI migration and data transformation, are well aware of the nuances of both platforms.
Let’s make an in-depth Tableau vs Power BI comparison to assist you with your decision-making process.
Tableau vs Power BI Features and Capabilities Comparison
While both platforms have powerful features, they are built to meet specific organizational goals, as well as user needs.
Table of Contents
- Tableau vs Power BI Features and Capabilities Comparison
- Tableau vs Power BI: Reporting and Dashboarding Compared
- Cost-Effectiveness and Licensing
- The Sparity Advantage: Automating Your Migration with BIPort v3.0
- Tableau vs Power BI comparison
- The Winner- The Right BI, The Right Partner
- Are you ready to Accelerate Your Tableau to Power BI Migration?
Power BI:
- Ease of Use & Interface: The easy-to-use and intuitive interface (similar to Microsoft products – i.e. Excel) and drag anddrop functionality allows non technical users to readily pivot and build Reports and Dashboards.
- Data Connectivity: Provides powerful native integration with Microsoft products (Azure, SQL Server, Excel, SharePoint, Dynamics 365) and robust connectors with many other data sources.
- AI & Machine Learning (ML): Power BI Copilot (2025 update) provides strong built-in AI functionalities with natural language and query building capabilities to guide users toward insights and visuals. Other features include quick insights, question and answer features, and robust capabilities for linking with Azure ML for providing advanced analytics and predictive modeling.
- Data Modeling: Power BI utilizes DAX (Data Analysis Expressions) – which is an extremely powerful language for users for performing advanced calculations and data modeling. Current Excel power users would benefit from using this functionality. Power Query also provides robust capabilities for data transformations.
- Collaboration: Seamless sharing and real-time collaboration is possible with Deep integration to Microsoft 365 tools.
- Performance: Excellent performance with Microsoft-native data sources, and efficient with large datasets when optimized with Premium capacities.
Tableau:
- Data Visualization & Storytelling: Tableau is known for its superior and highly customizable data visualizations. It empowers users to create pixel-perfect dashboards and visually stunning data stories.
- Data Exploration: It offers unparalleled flexibility for deep data exploration and ad-hoc analysis, which is widely liked by professional data analysts and data scientists.
- Data Connectivity: Tableau can be connected to a vast array of data sources, both cloud-based and on-premise, often with more flexibility for blending disparate datasets.
- Advanced Analytics: Complex statistical analyses and machine learning is possible through integration with R and Python / Tableau v3.0 is focused on smarter data stories and AI insights/alerts.
- Performance: Known for its high performance with very large and complex datasets, particularly when utilizing its Hyper in-memory data engine.
- User Interface: While it allows for many customizations for flexibility, its interface can take time to learn and can be difficult to navigate for beginners compared to Power BI given its level of customization.
However, if your priority includes visually stunning, highly customized, and deeply exploratory dashboards then Tableau fits.
But, Sparity’s Power BI offers much more than that including – Ease of use, strong Microsoft Ecosystem Integration and Powerful built-in AI for broader business adoption.
Tableau vs Power BI: Reporting and Dashboarding Compared
The demands for reports and dashboards differ significantly as there are organizations that need real-time monitoring, deep-dive analytics, or pixel-perfect reporting. Recognizing these demands is important to choose the appropriate BI tool.
Power BI Reporting:
- Dashboard Simplicity: Power BI is an excellent tool for developing clear, interactive, and fluid dashboards with real-time monitoring and top-level executive view capabilities.
- Report Types: Structurally strong reports, KPI’s and operational dashboards can be easily shared within the Microsoft ecosystem.
- Interactivity: Intuitive filtering, drill-down capabilities, and cross-report interaction.
- Embedding: Dashboards and reports can be embedded into other applications and web pages easily.
Tableau Reporting:
- Visual Storytelling: Tableau leads in exploratory analytics by offering highly artistic and detailed visuals and turns complex data visualizations into compelling stories.
- Dashboard Customization: Provides high flexibility for unique layouts, advanced chart types, and pixel-perfect design.
- Ad-Hoc Analysis: Empowers users to deeply explore data as it helps in quick insights during live analysis sessions.
- Public Sharing: Tableau Public enables free sharing of interactive dashboards.
For organizations looking for quick, business-friendly dashboards with deep integration into their existing Microsoft tools, Power BI is highly effective.
Cost-Effectiveness and Licensing
In terms of pricing, From Tableau vs Power BI, Power BI holds the edge for affordability, especially for organizations who have already invested in Microsoft tools.
Power BI:
- Enterprise-level pricing based on dedicated cloud resources, makes it highly scalable and cost-effective at large scale.
- Power BI is deeply integrated with Microsoft 365, which can yield a lower Total Cost of Ownership (TCO) for many businesses.
Tableau:
- The most comprehensive tier, is around $70 per user/month, and includes Tableau Desktop, Tableau Prep Builder, and a Tableau Server/Cloud license.
- Although Tableau offers robust features, premium pricing often means a higher price for each license, especially on large scale implementations.
For companies that are budget-conscious or already invested in Microsoft’s stack – Sparity’s Power BI is the most economical way to explore Power BI as good entry point and an option with built-in scalability.
The Sparity Advantage: Automating Your Migration with BIPort v3.0
If your analysis points towards Power BI as the ideal platform for your future, but you’re currently invested in Tableau, don’t worry, because the good news is that migration doesn’t have to be costly, or time-consuming.
Our BIPort Migration Assistant, now powered by its latest v3.0 release, makes the process easier.
What BIPort v3.0 Brings to Your Migration:
- Unmatched Speed: Our latest BIPort v3.0 make your migration up to 3x faster, thereby reducing overall migration efforts by up to 70%.
- Cost-Effectiveness: BIPort automates complex manual work thereby contributing to cutting down up to 70% of the migration cost.
- Seamless Tableau Server Connectivity: It configures credentials directly in BIPort for secure connection and automated discovery of reports, dashboards, and data sources, and helps streamline the analysis and migration process.
- Automatic Report Discovery & Rationalization: BIPort v3.0 identifies Tableau assets and analyzes dependencies, simplifying the planning of what to migrate, archive, or consolidate.
- Efficient Parameter & DAX Logic Conversion: It now supports advanced translation of Tableau parameters and complex calculated fields into optimized Power BI DAX expressions, preserving all calculated metrics, filters, and interactivity with less manual adjustment.
- Improved Semantic Data Model Generation: Helps developers by converting calculated columns and data relationships from Tableau, to directly usable models in Power BI and this accelerates report building and reduce rework.
- Intelligent Hyper File Conversion: Our updated engine are capable of analyzing Tableau Preparation flows and converts Hyper files into Power BI-compatible formats, that preserves data preparation logic.
- Developer-Friendly Assignment & Progress Tracking: Project managers and admins get role-based dashboards to assign tasks, monitor progress, and manage workloads effectively, enhancing collaboration and accountability.
Tableau vs Power BI comparison
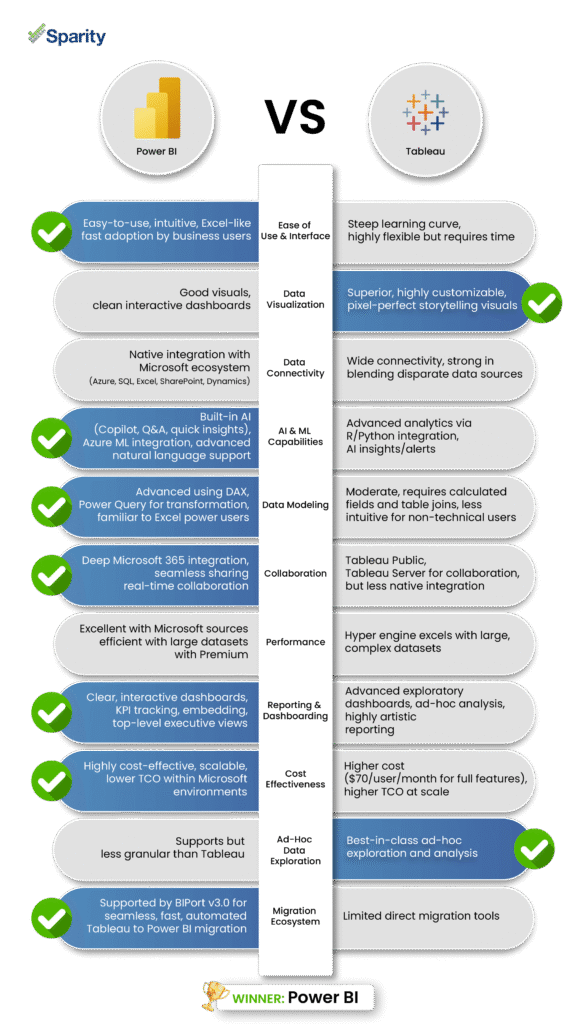
The Winner- The Right BI, The Right Partner
Deciding between Power BI and Tableau ultimately depends on your company’s business needs and long-term strategy.
But the winner is Power BI. Because, in a tech-first world of rapid development and companies doubling down on advanced analytics, it is the path forward.
Are you ready to Accelerate Your Tableau to Power BI Migration?
Don’t let the challenges of migration stop your BI strategy from maximizing its possibilities. Book a personalized demo with Sparity’s migration experts today and find out how BIPort v3.0 can accelerate your BI transformation journey.