Contents
- Introduction
- What is Microsoft Fabric and What’s in it??
- How to Enable Microsoft Fabric?
- Components of Power BI
- Integration of OneLake in Fabric
- Data Features and Data Flows in Data Factory
- Maintaining Infrastructure with Data Engineering
- Structure of Data Science
- Data Warehouse for Greater Control
- Streamlining Real Time Analytics
- Automated actions through Data Activator
- Copilot Generative AI’s Capabilities
- Fabric’s Retail Data Solutions
- Conclusion
- Related Posts
Introduction
Microsoft Fabric serves as a comprehensive analytics solution tailored for enterprises, encompassing a wide spectrum from data movement and data science to real-time analytics and business intelligence. This blog offers insight into what Microsoft Fabric entails and how we can use it to enhance our data needs.
What is Microsoft Fabric and What’s in it??
Microsoft Fabric is an integrated analytics solution for enterprises, offering data movement, science, real-time analytics, and business intelligence in a unified platform. Built on a Software as a Service (SaaS) foundation, it amalgamates components from Power BI, Azure Synapse, and Azure Data Factory, providing shared experiences, centralized administration, and a unified data lake. Fabric includes components like Data Engineering, Data Factory, Data Science, Data Warehouse, Real-Time Analytics, and Power BI. The platform is structured around OneLake, a data lake built on Azure Data Lake Storage Gen2, eliminating silos and enabling easy data sharing. It caters to ISVs with integration paths ranging from basic connections to custom workload creation on the Fabric platform.
Activate your data's full potential—introducing Microsoft Fabric: https://t.co/LCuZITqkX5 #MicrosoftFabric pic.twitter.com/H0HUOQOo6v
— Microsoft Power BI (@MSPowerBI) July 24, 2023
How to Enable Microsoft Fabric?
To enable Microsoft Fabric in Power BI for your organization, ensure prerequisites like having admin roles such as Microsoft 365 Global admin, Power Platform admin, or Fabric admin. Enable Microsoft Fabric for your entire tenant or a specific capacity through the admin portal, allowing users to create Fabric items based on selected configurations. Security groups can be utilized to control access. Consider that capacity admins can override tenant settings. Disabling it restricts item creation but allows viewing permissions. Users without Fabric access can still view items and icons in shared workspaces or capacities. Be mindful of regional availability restrictions for Microsoft Fabric. Regularly check and manage settings through the admin portal for optimal configuration.
Components of Power BI
A business intelligence tool by Microsoft called Power BI combines a multitude of data services and connectors to produce an integrated set of visual insights from several data sources. Along with Power BI Desktop for Windows and the Power BI online service, it also includes mobile apps for iOS, Android, and Windows. Additional components include Power BI Report Builder and Power BI Report Server. Depending on what they do, users access different Power BI components. The workflows include connecting to Power BI Desktop data sources, generating reports, and publishing them to the Power BI service for shared viewing. Power BI Report Server allows deployment behind firewalls and supports on-premises report administration.
Integration of OneLake in Fabric
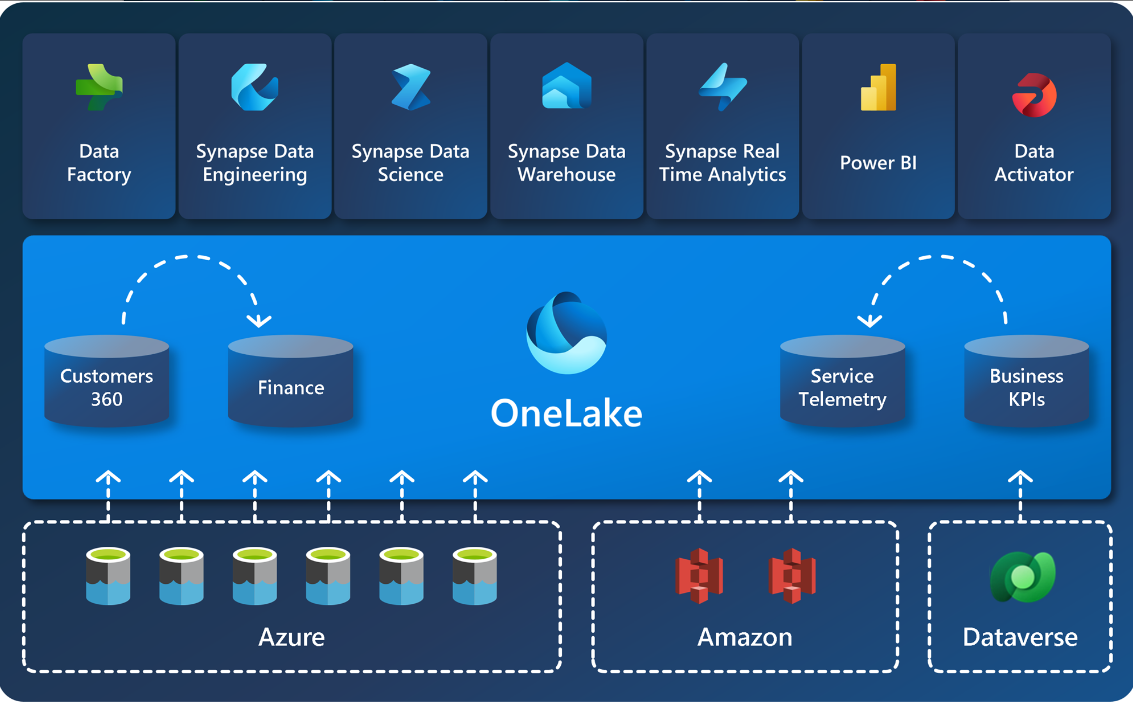
OneLake, integrated with Microsoft Fabric, is a unified data lake designed for organizational analytics, offering a single repository for diverse data types. Governed by default within tenant boundaries, it supports collaborative distributed ownership through workspaces. Built on Azure Data Lake Storage (ADLS) Gen2, OneLake is open and compatible with existing applications and APIs. The OneLake file explorer for Windows simplifies data lake interaction. Emphasizing one copy of data, it facilitates cross-domain data connections through shortcuts, eliminating unnecessary duplication. Multiple analytical engines, such as T-SQL and Spark, operate on data stored in Delta Parquet format, ensuring flexibility and efficiency without data movement. Users can use Power BI’s Direct Lake mode for seamless reporting.

Credits: Microsoft
Data Features and Data Flows in Data Factory
Data Factory provides a modern data integration experience, allowing users to ingest, prepare, and transform data from various sources. Fast Copy facilitates quick data movement, which is crucial for bringing data to the Lakehouse and Data Warehouse in Microsoft Fabric. The two primary features are dataflows and pipelines. Dataflows offer a low-code interface with over 300 transformations, supporting easy data ingestion and transformation. Built on the Power Query experience, it empowers users from citizens to professional data integrators. Data pipelines enable cloud-scale workflow capabilities, allowing the creation of complex ETL workflows with control flow logic. The configuration-driven copy activity and support for various data tasks make it a versatile tool for end-to-end ETL data pipelines.
Maintaining Infrastructure with Data Engineering
Data Engineering empowers users to construct and maintain infrastructures for efficient data collection, storage, processing, and analysis. Key components include lakehouses for unified structured and unstructured data management, Apache Spark job definitions facilitating batch/streaming job execution on Spark clusters, interactive notebooks for code creation and sharing in various languages, and data pipelines crucial for reliable and scalable data movement and transformation. This comprehensive suite ensures accessible, organized, and high-quality data, with lakehouses supporting SQL-based queries, analytics, machine learning, and advanced analytics techniques.
Structure of Data Science
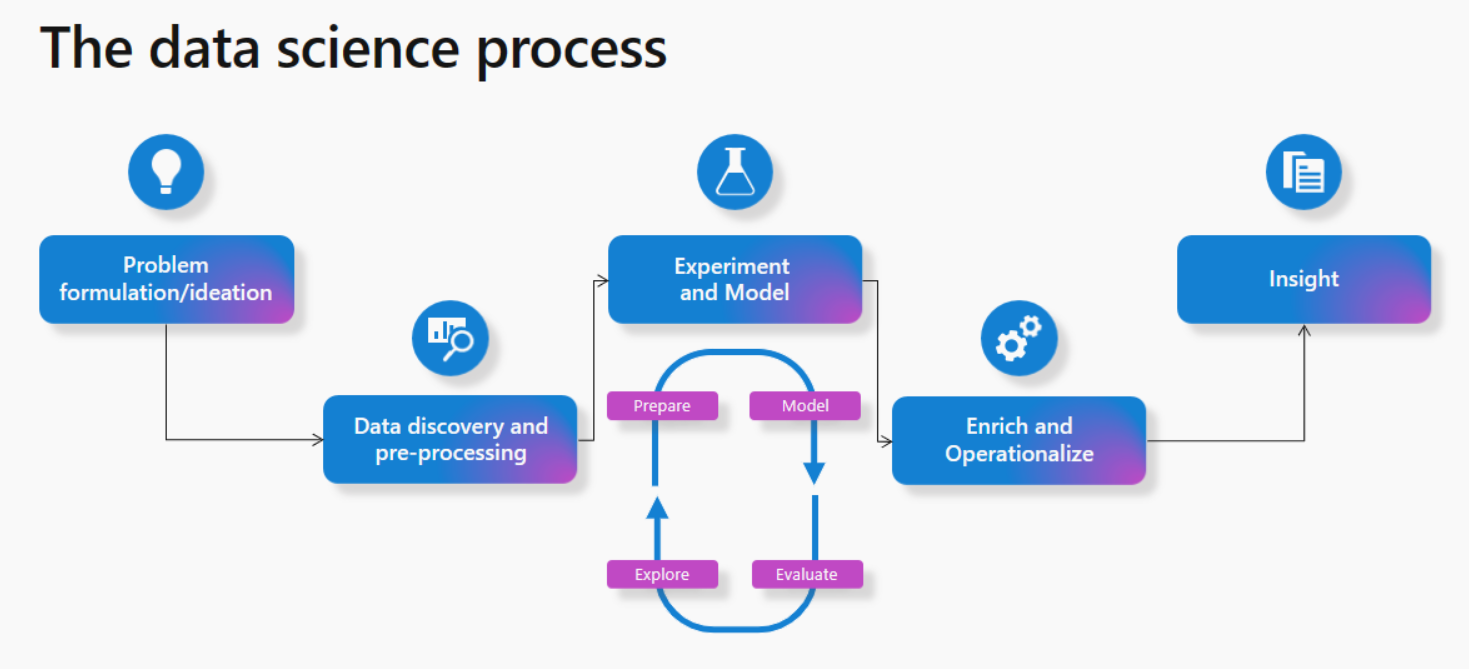
Microsoft Fabric in Data Science streamlines end-to-end workflows, enabling users to explore, clean, and model data for enriched insights. It facilitates seamless collaboration between business analysts and data scientists. In problem formulation, collaboration is enhanced, while data discovery involves OneLake integration for efficient data interaction. The exploration phase utilizes tools like Apache Spark and Python, with Data Wrangler for cleansing. Experimentation leverages PySpark, MLflow, and SynapseML for scalable machine learning. Notebooks handle batch scoring, with results easily shared through Power BI reports. The preview feature, Semantic Link, bridges the gap between Power BI semantics and Synapse Data Science, fostering collaboration and accelerating productivity.

Credits: Microsoft
Data Warehouse for Greater Control
Microsoft Fabric offers a lake-centric data warehouse in two distinct experiences: the SQL analytics endpoint and the Warehouse. The SQL analytics endpoint is a read-only, automatically generated warehouse for T-SQL querying, supporting views and procedures. It is part of the Lakehouse, facilitating data engineering and Spark usage. In contrast, the Warehouse is a traditional data warehouse with full T-SQL capabilities, supporting transactions, DDL, and DML queries. Both leverage open data formats, such as Delta, and offer autonomous workload management. Virtual warehouses with cross-database querying enable seamless integration of diverse data sources. The Warehouse provides greater control and flexibility, while the SQL analytics endpoint offers simplicity and ease of use.
Streamlining Real Time Analytics
Real-Time Analytics in Microsoft Fabric simplifies data integration, enabling scalable analytics for diverse users. It offers quick insights through automatic streaming, indexing, and on-demand visualizations. Its unique features include real-time event capture, versatile data structure support, and seamless Fabric integration. Industries like finance and transportation benefit across various applications. Users leverage it for high-freshness data, transforming streaming data, and querying large datasets with low latency. Integration with Eventstream, KQL database, and Power BI facilitates end-to-end analysis.
Automated actions through Data Activator
Data Activator, currently in preview on Microsoft Fabric, offers a no-code experience for automated actions based on changing data patterns. It monitors Power BI reports and Eventstreams, triggering actions like alerts or Power Automate workflows on specified thresholds or patterns. Users can create a digital nervous system without relying on IT or developers, addressing issues like declining sales, proactive logistics management, and customer retention. Core concepts include Events (data streams), Objects (monitored entities), Triggers (conditions for actions), and Properties (reuseable logic). This empowers business users to self-serve, reducing dependence on costly internal teams for monitoring and alerting solutions.
Copilot Generative AI’s Capabilities
Microsoft Fabric’s Copilot in preview offers AI-enhanced tools for data science, data engineering, and Power BI. It facilitates code completion, automates tasks, and provides templates for data professionals. Copilot follows responsible AI standards, storing customer data for 30 days on Azure OAI. Admins must enable Copilot, and users should review outputs for accuracy. It currently performs best in English, with potential limitations in other languages. Prebuilt AI services are available in specific Azure regions. Check out our comprehensive guide to Copilot in Power BI.
Fabric’s Retail Data Solutions
Microsoft Fabric’s Retail Data Solutions empower retailers to enhance operational efficiency and customer satisfaction by addressing challenges such as managing vast data volumes, overcoming application silos, and ensuring real-time responsiveness. Through a standardized data model, connectors, and business intelligence capabilities, retailers can unify and analyze diverse data sources, driving insights for inventory optimization, customer segmentation, and dynamic pricing. Additional features include a retail industry data model, Copilot template for personalized shopping, Sitecore OrderCloud connector, and frequently bought together recommendations, enabling retailers to make strategic decisions and deliver exceptional value in a competitive market.
Conclusion
As Microsoft Fabric already hits the market, businesses can leverage its capabilities for all their data requirements. While Fabric makes our work easy, we cannot perform every single task with Copilot; you need an expert team of data engineers who are skilled in Fabric and Power BI. Sparity will be your perfect partner who is an expert in data science, data engineering, and data visualization, leveraging Power BI with our expert Power BI team. Contact us today for all your data requirements.


