
Predictive Maintenance Dashboards have become a necessity for any industry where asset performance directly impacts business outcomes, from manufacturing facilities to utility providers. By visualizing complex data from sensors and machinery in a tool like Power BI, these dashboards allow maintenance teams to predict equipment failures before they occur. This proactive approach helps avoid unexpected repairs, minimize costs, and extend the lifespan of critical assets.
With artificial intelligence, the internet of things, and other analytic complexities, maintenance teams can predict failures even before they occur. This typically leads to avoiding unexpected failures, avoiding repair, and minimizing costs. Power BI has emerged as one of the most powerful tools when it comes to visualizing, tracking, and sharing these insights.
This blog will provide a deep understanding of predictive maintenance, its relative role, step-by-step instructions to build your dashboard, and include how we can ease the migration with the use of Sparity’s BIPort 3.0 to get into Power BI without losing data and time.
Predictive Maintenance in Manufacturing
Predictive maintenance utilizes real-time data and analytics to predict when equipment or machinery will fail, enabling organizations to plan interventions. This is different from reactive maintenance (improve after failure) and preventative maintenance (scheduled servicing, with technicians generally performing an inspection regardless of need); predictive maintenance relies on data collected from sensors and asset monitoring to maximize uptime.
Table of Contents
- Predictive Maintenance in Manufacturing
- Benefits of Predictive Maintenance Dashboards
- Why is Power BI essential for Predictive Maintenance Dashboards?
- Key Data Sources for Predictive Maintenance Dashboards
- Planning Your Predictive Maintenance Dashboard
- Step-by-Step Guide: Building Your Power BI Dashboard for Predictive Maintenance
- Best Practices for Creating Predictive Maintenance Dashboards
- Frequently Asked Questions
- 1. What is predictive maintenance in manufacturing?
- How does Power BI assist in predictive maintenance?
- Can Sparity’s Biport 3.0 facilitate data migration to Power BI?
- What KPIs should be monitored in predictive maintenance dashboards?
- How do predictive maintenance dashboards enhance operational efficiency?
Importance of Data-Driven Maintenance
Fully modern facilities, equipped with sensors monitoring temperature, vibration, pressure, etc., produce huge amounts of data. Most industries today utilize AI/ML systems to learn patterns in that data and detect general anomalies that would indicate a developing problem. Predictive maintenance helps teams with actionable insights, thereby helping them to address issues before failures occur.
Benefits of Predictive Maintenance Dashboards
- Minimized Downtime: Implementing predictive maintenance can decrease unplanned downtime by 30–50%, which instantly saves costs for large-scale manufacturers.
- Lower Costs: By optimizing maintenance schedules and targeting the actual needs, businesses can save 12-30% in maintenance costs.
- Asset Longevity: Proactive care extends asset lifespans by 20–40%, which boosts ROI and reduces replacement costs.
- Operational Efficiency: Scheduling interventions during planned periods minimizes disruptions, enhances throughput, and assures safety.
Why is Power BI essential for Predictive Maintenance Dashboards?
Visibility of asset health is crucial to determine predictive maintenance. This includes timely data collection, analysis, and actionable insights that help teams solve the issues before they escalate.
Power BI offers-
- Clear visualizations – Power BI transforms complicated data into interactive charts, gauges, maps, and dashboards, instantly.
- Seamless data integration – Consolidate information collected from IoT devices, ERP systems, cloud platforms, and spreadsheets into a single environment.
- Real-time updates – Power BI Dashboards utilize the most current data available to provide real-time updates for faster, informed decision-making.
- Collaboration features – Assists in sharing live dashboards in a secure environment with operators, managers, and technicians for operational efficiency.
By leveraging Power BI, businesses can monitor asset health and act on the same set of reliable insights.
Key Data Sources for Predictive Maintenance Dashboards
Building effective dashboards requires aggregating data from:
- Sensor and IoT Data: Data is obtained from the sensors that measure vibration, temperature, pressure, acoustic signatures, and other performance metrics. IoT-driven asset monitoring underpins failure prediction and dynamic analytics.
- Maintenance Logs & Historical Records: Data collected from past repairs, interventions, and part replacements are essential for AI models and statistical analysis.
- Asset Details & Operational Metrics: Information such as asset age, usage patterns, specifications, and productivity metrics helps in predictive analysis.
- External Data: Incorporating extra factors such as environmental conditions, weather, usage cycles, and supply chain enhances the accuracy of predictive maintenance.
Planning Your Predictive Maintenance Dashboard
Effective dashboard design requires planning. Follow the steps given below-
Determine key KPIs: Focus on critical metrics such as
- MTBF (Mean Time Between Failures)
- MTTR (Mean Time To Repair)
- Downtime costs
- Probability of failure
- Select visuals: Use line charts for time series sensor readings, gauge-style visuals for thresholds, cards for summary statistics, and alerts for critical conditions.
- Segment audiences: Customize the dashboards according to your department’s needs. For example, Operators are focused on alerts needed in real-time, managers need cost analysis, and technicians need full fault information.
- Identify frequency of updates: Real-time updates are critical for some operations; however, long-term performance analysis may only need periodic reviews.
Step-by-Step Guide: Building Your Power BI Dashboard for Predictive Maintenance
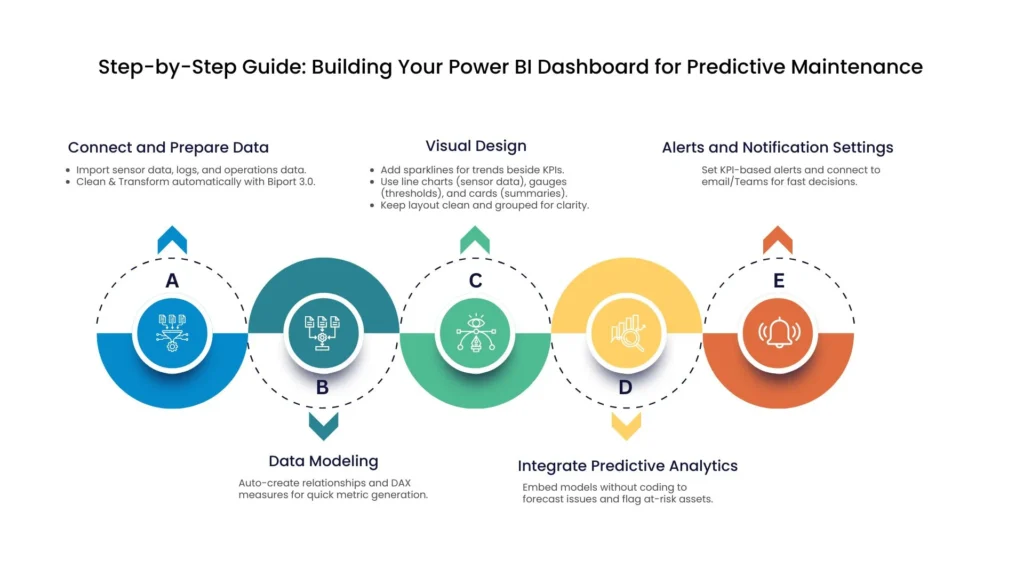
a) Connect and Prepare Data
- Import: Start by gathering data from sensor readings, maintenance logs, and operational datasets from all systems.
- Clean & Transform: Allow BIport’s 3.0 version to instantly clean, transform, and align data.
b) Data Modelling
- With Biport 3.0, data modeling is simplified as businesses can automatically establish relationships between datasets and DAX measures for critical metrics generated quickly.
c) Visual Design
- Sparklines: Insert mini charts alongside asset names/KPIs for quick trend analysis.
- Chart Selection: Use line charts for sensor trends, gauges for operational thresholds, and cards for summary statistics.
- User-Friendly Layout: When visualizations are grouped for related content, it de-clutters the design, allowing the viewer to clearly understand the visuals.
d) Integrate Predictive Analytics
Sparity’s Biport 3.0 allows you to embed predictive models without the need for extra coding. Easily forecast future failures, highlight at-risk assets, and prioritize maintenance.
e) Alerts and Notification Settings
Easily set automated alerts for critical KPI thresholds. To enable notifications, connect these alerts to email or Microsoft Teams to make coordinated decisions.
Best Practices for Creating Predictive Maintenance Dashboards
- Focus: Keep dashboards clear and display actionable metrics.
- Color Coding: Use status colors to highlight asset health, risks, and priorities to present your asset information quickly and effectively.
- Frequent Updates: Schedule regular refreshes to ensure data reflects current conditions.
- User-Centric Design: Include operators and managers in dashboard testing for the best user experience and usability
Conclusion
Multiple manufacturing companies are transitioning to predictive maintenance with an emphasis on empowering technological upgrades and optimizing asset management. Power BI has become the ultimate key for maintenance teams to have clear reports of their asset health, the ability to predict failures, and to enable tools to coordinate with responses efficiently.
Implementing Power BI solutions alongside solutions such as Sparity’s BIPort 3.0 for migration from other systems ensures fast, cost-effective, and accurate migration.
Frequently Asked Questions
1. What is predictive maintenance in manufacturing?
Predictive maintenance leverages real-time data to forecast equipment failures, and enables proactive interventions thereby reducing downtime.
How does Power BI assist in predictive maintenance?
Power BI visualizes sensor and operational data, and turns complex information into actionable insights for maintenance teams.
Can Sparity’s Biport 3.0 facilitate data migration to Power BI?
Yes, Biport 3.0 automates data cleaning and transformation, streamlining the migration process from legacy systems to Power BI.
What KPIs should be monitored in predictive maintenance dashboards?
Key KPIs include Mean Time Between Failures (MTBF), Mean Time To Repair (MTTR), downtime costs, and asset health indicators.
How do predictive maintenance dashboards enhance operational efficiency?
Dashboards provide real-time insights, enabling timely maintenance actions, reducing unplanned downtime, and optimizing resource allocation.