Our BI Modernization Checklist helps you migrate to Power BI in just 30 days ensuring real-time insights, scalability, and cost savings. Transform your data journey with Sparity today!
The gap between data gathering and actionable insight is closing quickly, and outdated BI tools are not helpful in today’s fast-paced environment. Heavy interfaces, slow refresh cycles, and bulky reporting have no chance of keeping up with the demands of a real-time, on-demand business climate. This is why BI Modernization is essential to replace legacy systems with agile and responsive solutions that drive timely, actionable insights.
But, Power BI changes all of that. With its cloud-based platform, easy-to-use dashboards, and open integrations, Power BI quickly enables companies to turn raw data into interactive, business-relevant insights at scale and speed. To truly embrace BI Modernization, it is not just about trading in a tool. It is about changing your entire organization’s view of how data is consumed.
Why BI Modernization?
Most companies know their BI tools are outdated, but few realize the cost of holding on. Gartner reports that 87% of organizations still have low BI maturity, relying on slow, fragmented systems. In one case, a global telecom giant replaced its legacy BI with Tableau and saw reports run 90% faster, with employees finally using insights in real time. That’s the real reason for BI modernization—it’s not just about new software, it’s about speed, adoption, and business impact.
Below is a list of what a BI Modernization platform, like Power BI, can do for your organization:
Smarter decisions made in less time: Using interactive dashboards, your teams are provided real-time insight that allows them to respond to shifting conditions.
The ability to scale: Business intelligence can easily handle an exploding volume of data without any slow-down.
Cloud-ready from the start: Integration with Azure and other cloud hosting platforms means that you’ll deploy quickly and scale as needed.
Empowered teams: Business users can explore data and build reports on their own; they no longer have to wait for IT to build dashboards.
Reduced long-term costs: Avoid paying for expensive licenses, drive down infrastructure maintenance and cut back on ongoing support.
Table of Contents
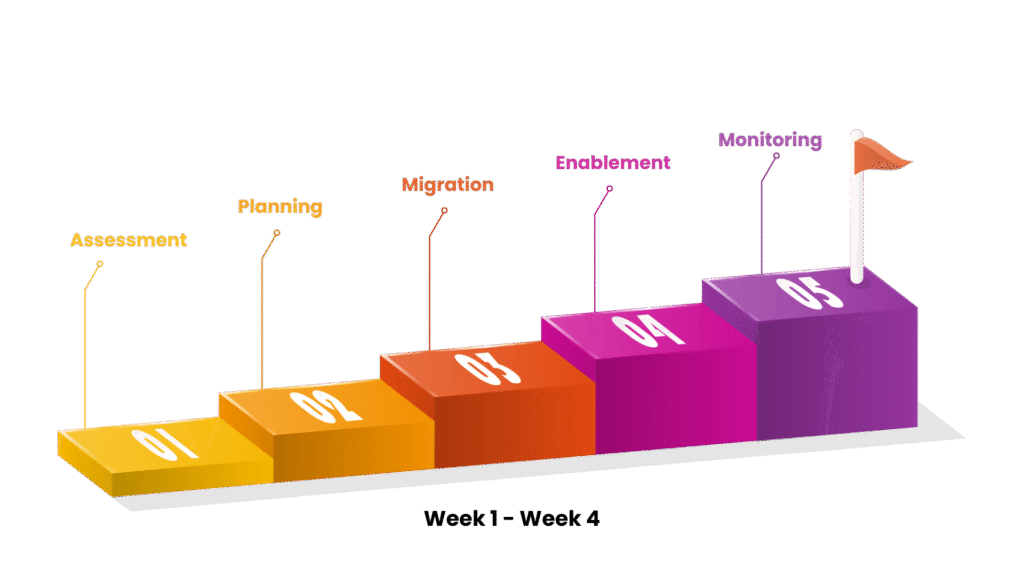
BI Modernization in 30 Days: A Weekly Breakdown
Week 1: Strategy & Assessment
1. Analyze Your Current BI Landscape
Start by determining what’s currently in use:
-
- Which BI tools are active? (e.g., Cognos, SAP BO, SSRS)
-
- Who are the end users and how do they utilize the reports?
-
- What data sources are involved?
Create an inventory of existing dashboards and reports. Flag those still relevant and retire those that are obsolete.

2. Establish Metrics of Success
The BI Modernization process should align with business objectives. This depends on some factors like- improving adoption, increasing real time analytics, or reducing costs.
-
- Reduction in report turnaround time
-
- Increase in self-service adoption
-
- Enhanced visualization quality
Week 2: Planning & Prototyping
3. Design the Future-State Architecture
Power BI offers several deployment options:
-
- Reports can be created through Power BI Desktop
-
- Power BI Service for cloud collaboration and sharing
-
- Power BI Gateway: For safe data access from on-premises systems
-
- Power BI Embedded: To integrate analytics into customer-facing apps
It is critical to choose an architecture that is compatible with your scalability, compliance, and cloud readiness objectives.
4. Identify Data Sources & Integration Strategy
Determine the data sources to be connected, for instance- SQL, Oracle, Excel, SharePoint, APIs, etc. Use Power Query for data shaping, transformation, and cleansing. Prepare a plan for data refresh schedules and authentication methods.
5. Create a Pilot Report
Select a high-value, low-complexity example report. Rebuild the report with Power BI, using the same data as the traditional report but with better visualizations and interactivity. This helps stakeholders understand the impact and engages them in future rollouts.
Week 3: Migration & Testing
6. Prioritize and Migrate Reports
Focus on the top 20% of reports that provide 80% of the value. Avoid a one-to-one migration of all legacy reports, as consolidation is the best option.
7. Translate Logic from Legacy Tools
Legacy BI Platforms commonly utilize different formula engines. You can DAX (Data Analysis Expressions) in Power BI to re-implement calculated fields, KPIs, and implied business logic. Validate outputs against legacy reports for accuracy.
8. Configure Refresh, Security & Sharing
-
- Data refresh schedules (hourly, daily, etc.)
-
- Row-level security for sensitive data
-
- Workspaces and user roles for controlled access
Ensure compliance with data governance standards throughout the transition.
Week 4: Enablement & Go-Live
9. Train End Users
Power BI’s self-service capabilities are only as strong as user adoption. Schedule brief, role-based training sessions to cover:
-
- Dashboard navigation
-
- Applying filters and bookmarks
-
- Exporting and sharing reports
-
- Building basic visuals
Create internal documentation and offer ongoing support during the transition.
10. Deploy in Phases
Start with one department or business unit. Gather feedback from users, address any gaps, and then gradually scale up. Using a BI Modernization approach with phased deployments helps build support and reduce resistance, creating momentum for wider adoption.
11. Monitor, Optimize & Retire Legacy Systems
Once Power BI is live and stable:
-
- It is essential to monitor report usage and performance
-
- Optimize slow-loading visuals or queries
-
- Retire legacy infrastructure in phases to reduce overhead
What You Should Have by Day 30
-
- Modern Power BI dashboards for key business units
-
- Integrated data sources with auto-refresh enabled
-
- Trained business users accessing live reports
-
- Legacy systems gradually phased out
-
- BI governance framework in place
Modernizing your BI platform can seem time-consuming, but BI Modernization doesn’t have to be a complex process. At Sparity, we specialize in helping organizations transition from legacy BI tools to Power BI with speed, precision, and minimal disruption through effective BI Modernization strategies.
From assessment to architecture, from data modeling to deployment we partner with you at every step to ensure a seamless modernization journey.
Let’s turn your BI Modernization into a business advantage. Talk to our Power BI experts and get started today.


