
Tableau to Power BI migrations do not stall due to visual conversion alone. Instead, reporting bottlenecks compound across the entire data lifecycle: from un-audited legacy data sources and scattered calculation logic to security mapping and post-go-live scalability. Tableau to Power BI Migration delays directly inflate Total Cost of Ownership (TCO) through extended Tableau and Power BI platform licensing fees and wasted engineering hours. Successfully executing a transition requires addressing friction at every phase of the technical pipeline.
Tableau to Power BI migrations are architectural shifts. To execute a seamless transition, enterprise teams must eliminate these top 10 hidden bottlenecks across 8 core phases of Tableau to Power BI migration lifecycle.
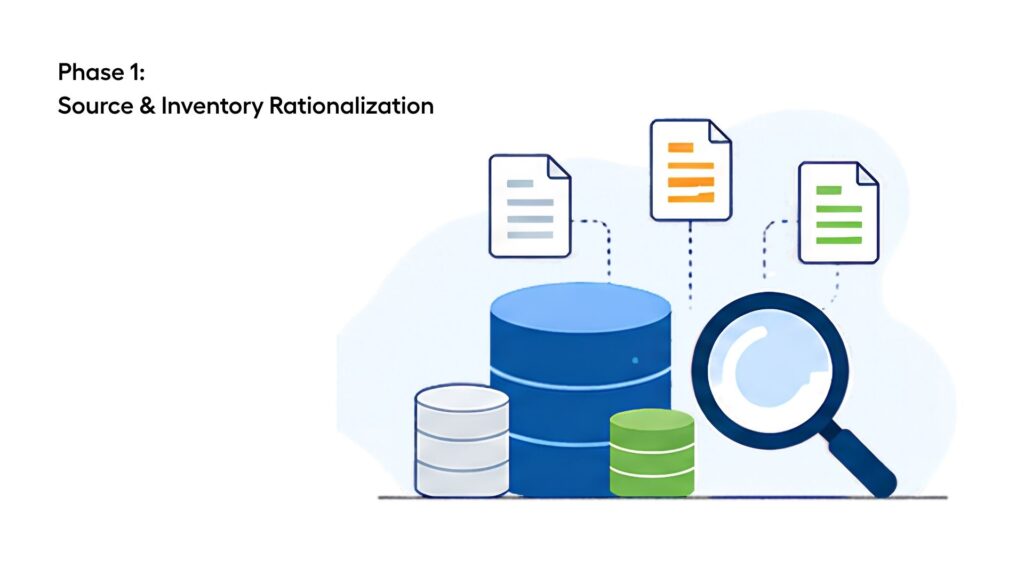
Phase 1: Source & Inventory Rationalization
Hidden bottleneck 1. Unfiltered Legacy Report Inventories
- The Bottleneck: Many organizations frequently attempt to migrate every Tableau workbook without auditing usage, wasting valuable engineering resources on stale, duplicate, or ad-hoc dashboards.
- The Strategic Need: Project success depends on performing automated usage and dependency audits prior to migration, ensuring execution teams focus strictly on active, business-critical assets.
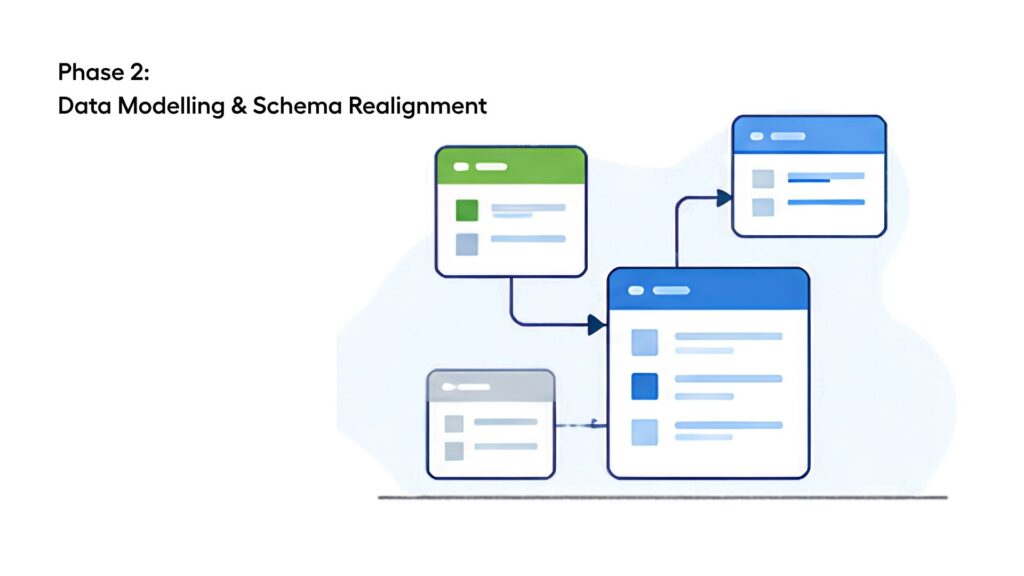
Phase 2: Data Modelling & Schema Realignment
2. Underlying Schema Mismatches
- The Bottleneck: Tableau and Power BI platforms rely on fundamentally different data architectures (e.g., wide denormalized tables versus strict star schemas versus direct database querying), leading to poor target performance if unaddressed.
- The Strategic Need: Migration strategies must incorporate automated semantic extraction to read legacy data relationships and restructure them to fit the performance requirements of the target query engine.
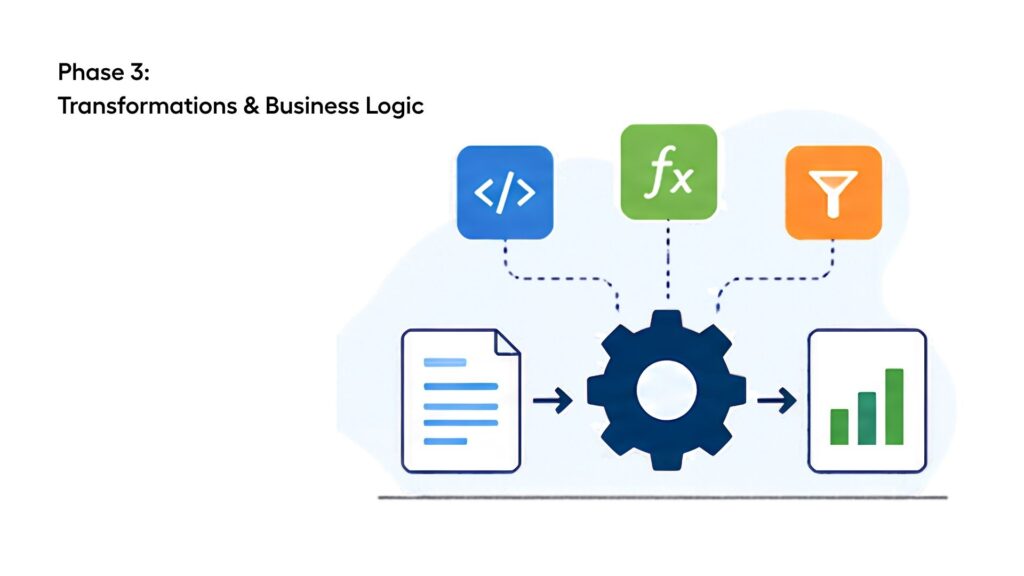
Phase 3: Transformations & Business Logic
3. Calculation and Query Syntax Translation Stalls
- The Bottleneck: Manually auditing and translating proprietary calculations, nested expressions, and database queries across different vendor syntaxes creates severe technical backlogs and introduces human error.
- The Strategic Need: Organizations need automated syntax-parsing engines capable of reading source platform logic and converting it into optimized, native target expressions without manual rewriting
4. Fragmented Metric Definitions Across Departments
- The Bottleneck: Different business units frequently calculate the same KPI differently across separate legacy reports, causing metric discrepancies to surface during migration testing.
- The Strategic Need: Enterprise migrations require specialized semantic consolidation techniques to unify fragmented legacy logic into a single, governed source of truth during the transition.
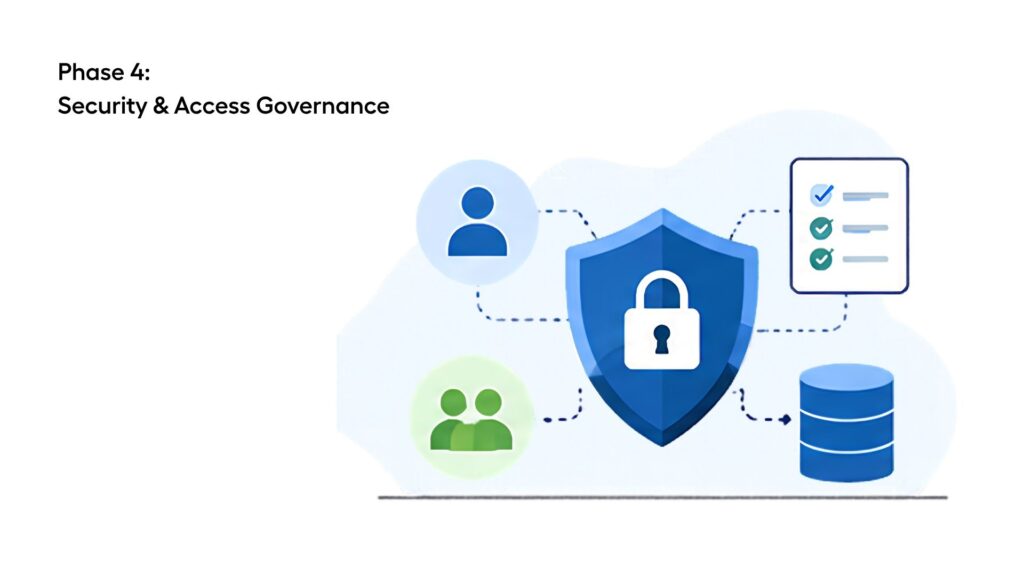
Phase 4: Security & Access Governance
5. Security Policy and Governance Re-configuration
- The Bottleneck: Reconfiguring Row-Level Security (RLS), user groups, and object-level permissions manually introduces severe security risks and delays release dates.
- The Strategic Need: Automated governance mapping is essential to extract source security rules during metadata parsing and pre-populate target platform security roles seamlessly.
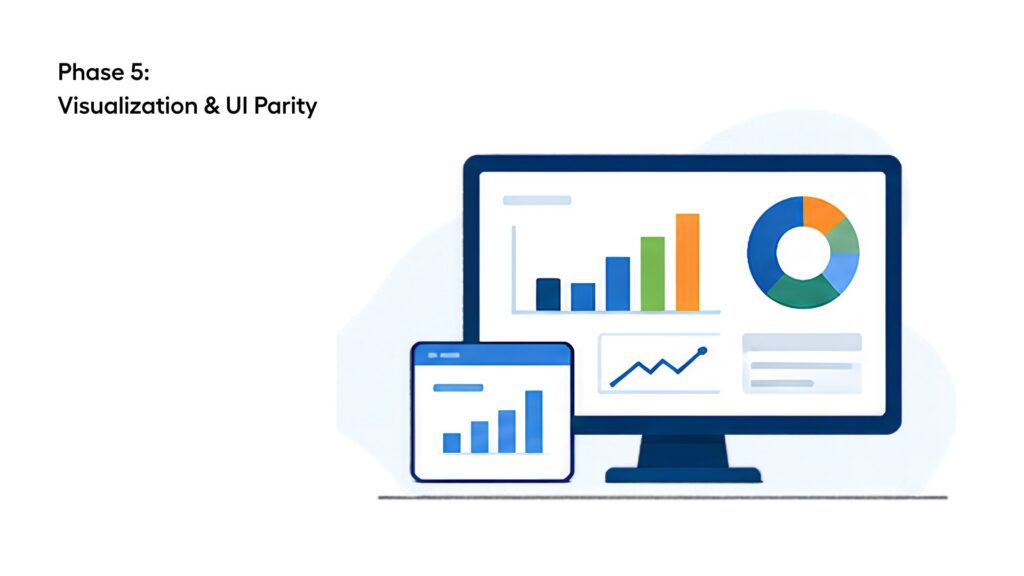
Phase 5: Visualization & UI Parity
6. Manual Canvas Re-Authoring and Visual Layouts
- The Bottleneck: Manually recreating hundreds of dashboard layouts, visual containers, custom charts, and formatting properties in a new tool consumes thousands of developer hours and inflates project budgets.
- The Strategic Need: Eliminating layout backlogs requires advanced metadata translation capabilities that automatically parse source dashboard structures and map them directly into native target artifacts.
7. Interactivity and UI Feature Parity Gaps
- The Bottleneck: Native user interactions—such as specialized drill-through workflows, custom tooltips, or dynamic visual state toggles—do not map 1:1 between different vendors, causing user pushback.
- The Strategic Need: Projects require a clear governance framework that balances automated layout conversion with target-native UX design, preventing endless attempts to clone legacy quirks.
Phase 6: Quality Assurance & Testing
8. Data Validation and QA Overhead
- The Bottleneck: Verifying numbers line-by-line between legacy and target reports across large datasets during Quality Assurance (QA) can swallow up to 40% of the entire project timeline.
- The Strategic Need: Streamlining QA requires scripted metric comparison workflows and automated validation pipelines that highlight discrepancy points instantly without tedious manual spot-checking.
Phase 7: Sharing, Adoption & SME Sign-Off
9. SME Availability and Sign-Off Stalls
- The Bottleneck: Business Subject Matter Experts (SMEs) lack the bandwidth for lengthy review cycles to validate converted reports, causing User Acceptance Testing (UAT) bottlenecks.
- The Strategic Need: Accelerating sign-offs requires rapid prototype generation capabilities, allowing SMEs to evaluate working, converted reports early in the project lifecycle.
Phase 8: Scalability & Infrastructure Monitoring
10. Compute Capacity & Gateway Constraints at Scale
- The Bottleneck: Post-cutover traffic spikes, simultaneous scheduled dataset refreshes, and un-optimized Direct Query traffic strain target gateway and cloud capacity, leading to slow rendering times and gateway timeouts.
- The Strategic Need: Enterprise execution requires pre-migration capacity planning and automated query optimization to ensure infrastructure scales seamlessly under peak enterprise concurrency.
Conclusion
Reporting bottlenecks can cause disruptions in your Tableau to Power BI migration journey. Hence, you need to be aware of such hidden bottlenecks and have a plan to counter them.
You can also choose Sparity for seamless migration through AI-powered Tableau to Power BI migration accelerator for quick and efficient transition.
Frequently Asked Questions
What are the best practices for migrating from Tableau to Power BI?
The best practice for migrating from Tableau to Power BI is not to rush into it. Carefully analyze your current reports, logics, and focus on a phased rollout rather than a direct one-to-one copy.
Which is more demanding, Tableau or Power BI?
Going with overall market demand, Power BI dominates it. Both the tools are a little different to each other where Power BI offers great UI and is relatively easier than Tableau. That is one of the reasons for Power BI being dominant in the market.
What is the best tool for converting Tableau dashboards to Power BI reports?
Sparity’s BIPort is one of the best tools for converting Tableau dashboards to Power BI reports as it offers faster, phased migration.
What is the Microsoft equivalent of Tableau?
Power BI is the Microsoft equivalent of Tableau. It is a business intelligence tool from Microsoft.